|
Box 3. Evidence-based tax policy? Incorporating social policy objectives in the GST
Once the RNR is known, it has to be operationalized by making decisions relating to:
exemptions, the structure of rates, including how many rates to have, and whether to have a
separate lower rate for merit/essential goods and a higher rate for de-merit or sin goods; and the
threshold below which firms will not have to be part of the GST tax administration.
Typically, the assignment of goods to different tax categories will be motivated by
considerations of equity. Goods that account for a large share of expenditures of poorer
households—for example, food--will either be exempt or placed in a lower rate category. But
these decisions have to be underpinned by analysis and evidence. This section undertakes such
an analysis and then compares the outcome of this analysis with current policy. In other words,
the question is whether current tax policy is consistent with social objectives in relation to a
number of key commodity groups:
These groups have been chosen because they are of special interest in the context of the GST:
either they are exempted (food, gold (Centre), power, non-medicine health, and education); or
they are taxed at a lower rate (clothing, gold (States), medicines); or they are charged at very
high, demerit rates (petroleum, tobacco, and alcohol).
Two concepts provide the starting point for making policy decisions based on evidence: equity
and effectiveness.
Equity allows for categorization of goods as merit/essential/sensitive (hereafter “merit”), etc. Goods that account for a high share of expenditure of the poorer households will typically be
merit goods; and a related feature will be that this share will decline for richer households.
But even if a good is a merit good, warranting a lower or zero rate, policy makers will want to
ask how effective that decision will be based on how well targeted the implicit subsidy will be,
where the implicit subsidy is the difference between taxing a good at the standard tax rate and
the lower or zero rate: if the poor also account for a large fraction of total expenditure on the
merit good, then the subsidy will be well targeted; if, on the other hand, they account for a small
share of the total expenditure, then the subsidy decision will come with the cost that most of the
benefits of the subsidy will accrue to the relatively better off.29
So, one can think of a commodity-wise benefit-cost analysis for determining the rate structure.
The benefit could be thought of as the subsidy rate for the target group, say the bottom four
deciles of the population.30 The subsidy essentially measures how much the expenditure of the
target group would be increased by exempting a good rather than taxing it at the standard rate.
The cost could be measured in relation to the principle of effective targeting. The cost is simply
that proportion of the total subsidy for any particular good that does not reach the target group
and instead “leaks” to the non-target group, in this case, the top 6 deciles.
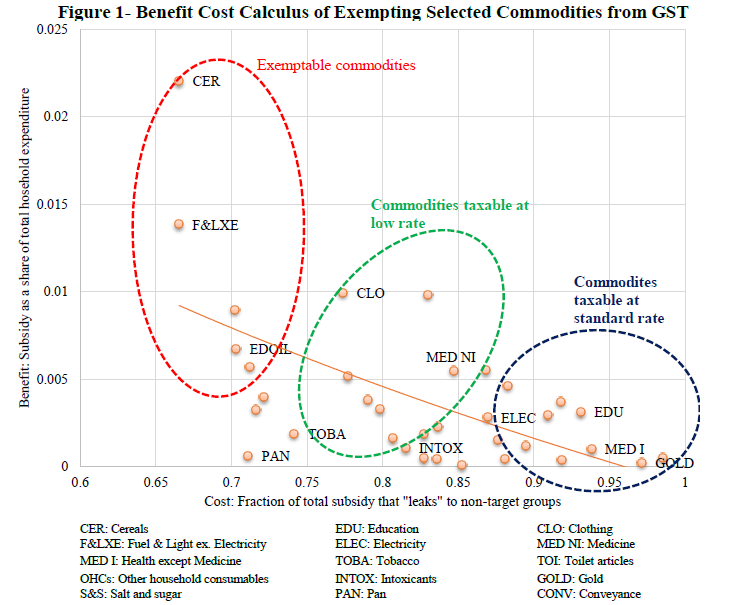
We depict this benefit cost analysis graphically in Figure-1 for different group of commodities.
We want to focus on the groups (and related sub-groups) that are going to be the focus of
important policy choices in the tioned earlier. The data are from the 2011-12 thick NSS
household expenditure survey.
The vertical axis measures the benefit—the effective subsidy rate, which is the subsidy as a share
of the total expenditure of the target group. The horizontal axis depicts the costs measured as the
share of total subsidy on any given product that leaks to the non-target group.
Three circles are drawn to highlight desirable evidence-based choices: commodities in the north-west corner of the graph circled in red are socially worthy of exemption because the benefits are
high and the costs are low. These include cereals, vegetables, pulses, edible oils, and fuel and
light (excluding electricity). Conversely, commodities in the south-east corner of the graph,
circled in blue are less worthy of being treated favorably in tax terms because the benefits are
low and the costs high. These include gold, non-medicine health services, education, and power.
In the middle are commodities, circled in green, that lie somewhere in between that are perhaps
worthy of being included at the lower tax rate. These include milk, poultry products and perhaps
clothing.31
Source: NSS 68th round data
The data that underlie this graph are presented in Table 1 for the commodities of policy interest.
In each table, the share of each commodity in total expenditure of the target group (bottom 40
percent, B40) and the non-target group (the top 60 percent, T60) is presented. This is a measure
of equity.
Table 1: Categorizing Commodities according to Equity and Effectiveness Criteria
| Commodity |
EQUITY: Expenditure on
commodity as share of total
expenditure on all commodities |
EFFECTIVENESS: Share of
total expenditure on commodity
accounted for by target group |
| Food |
Bottom 4
deciles |
Top 6
deciles |
Bottom 4
deciles |
Top 6
deciles |
| 38.3% |
25.9% |
24.7% |
75.3% |
|
excluding PDS subsidy |
36.5% |
25.5% |
24.2% |
75.8% |
| Cereals |
15.7% |
7.0% |
33.4% |
66.6% |
|
excluding PDS subsidy |
14.2% |
6.6% |
30.1% |
62.8% |
| Fuel & Light ex. Electricity |
9.9% |
4.4% |
33.5% |
66.5% |
|
excluding PDS subsidy |
9.0% |
4.1% |
32.5% |
67.5% |
| Clothing |
7.1% |
5.4% |
22.6% |
77.4% |
| Medicines |
4.5% |
5.0% |
16.8% |
83.2% |
| Education |
2.2% |
6.6% |
6.9% |
93.1% |
| Electricity |
2.0% |
3.0% |
13.1% |
86.9% |
| Beverages(non-alcoholic) |
1.6% |
1.9% |
16.3% |
83.7% |
| Tobacco |
1.3% |
0.9% |
25.8% |
74.2% |
| Intoxicants including pan |
1.2% |
1.0% |
21.3% |
78.7% |
| Health (except medicine) |
1.0% |
2.5% |
7.9% |
92.1% |
| Gold |
0.2% |
1.2% |
2.9% |
92.1% |
|
Note:
1) The consumption categories are arranged in the decreasing order of benefit-cost ratio.
2) The category "food" includes cereals, cereal substitutes, pulses and products, egg, fish and meat;
vegetables, fruits, processed food, packaged food, salt and sugar
3) The category "Fuel and light excluding PDS subsidy excludes the consumption of Kerosene (PDS)
4) The category Cereals excluding PDS subsidy excludes consumption of Rice-PDS and Wheat/Atta-PDS |
Source: NSS
The table 1 also presents the share of the total expenditure on a commodity group that is
accounted for by the target and non-target groups. This provides a measure of effectiveness
because the greater the expenditure accounted for by the non-target group the more the subsidy
will not reach the target group.
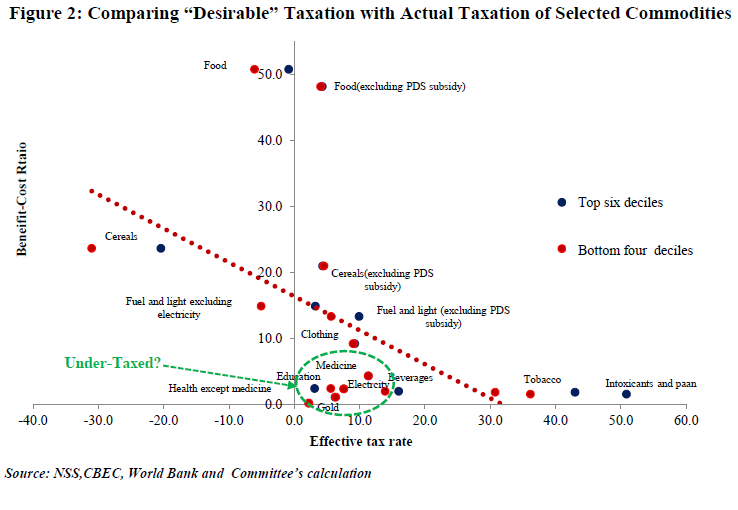
We can then compare how these commodities should be treated in terms of equity and
effectiveness and how they are in terms of the current effective tax rate on these same
commodities (Figure 2).
When measuring the tax on an exempted good, it is important to remember that the effective tax
need not be zero. If a good is exempted, it will not be able to claim tax credits on the taxes
embedded in it by way of the inputs that have gone into it. If rice flour is exempted, for example,
the tax paid on milling will be reflected in the price paid by the final consumer. This, of course,
would not be the case, if that good were charged a lower tax rate because in this case input tax
credits would be availed of. In other words, the difference between a good being taxed at a lower
rate say, 5 per cent and exempted could be less than 5 per cent (5-0) because of embedded
taxes.32
How do we measure embedded taxes? As part of inputs for this Committee, the World Bank, as
an illustrative exercise, computed the embedded taxes for 11 categories of goods for the bottom 4
and top 6 deciles based on input-output tables and detailed data for five large States: Andhra
Pradesh, Gujarat, Kerala, Karnataka, and Tamil Nadu.33 In Figure 2, the benefit cost ratio of
exempting a good is shown on the Y axis and the effective tax rate on the X axis. In principle,
the higher the benefit cost ratio, the lower should be the tax. The line of best fit is downward
sloping, indicating that tax policy is broadly sensible.
Food, fuel, and clothing
A number of commodities are treated fairly under the current system. Thus, merit goods such as food items, especially cereals, pulses, edible oils, vegetables, and fuel are appropriately taxed at
zero or low rates. Conversely, a number of demerit goods such as alcohol and tobacco are
appropriately taxed at high rates.
In the case of food and fuels, the PDS system helps make the system fair. For example, taking
account of the PDS, the effective tax rate on the bottom 4 deciles is -7.4% for food as a whole, -
32% for cereals, and – 5.7% for fuel and light excluding power. The PDS has therefore served as
reasonably effective social policy.
Clothing is also an anomaly but not as striking as the other commodities mentioned above. It is
taxed currently at about 3-3.5 percent even though it does not constitute as large an expenditure
item for the poor. On balance, it warrants being taxed at the lower rate by both the center and the
States.
Gold, silver and precious metals
Currently, gold, silver and precious metals face no central excise and most States tax these commodities at the non-standard rate of 1 per cent. There could be two reasons to under-tax
these metals: for reasons of equity and to promote savings. Consider each in turn.
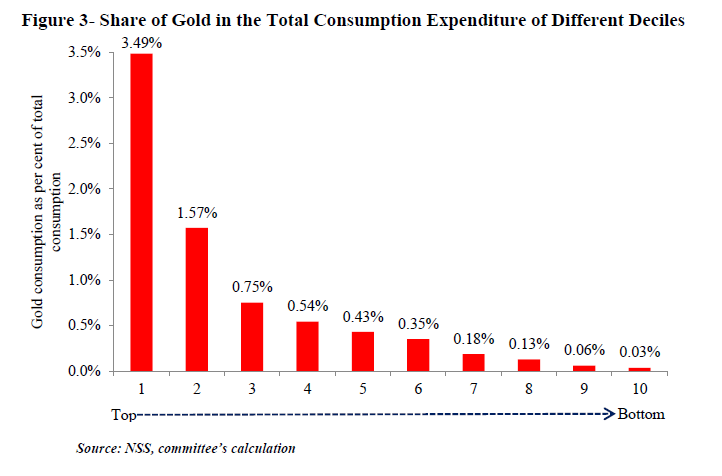
It turns out that there is very little achieved by way of equity and a high cost is paid for
exempting these commodities from taxation. Figures 3 and Table 2 illustrate these points. Gold
as a consumption good constitutes a small portion of the total expenditure of the poor and a
much higher share of the expenditure of the rich (Figure 3). It has the characteristics of a luxury
good than an essential good. For example, the richest decile spends 3.5 per cent of its
expenditures on gold, silver, and precious metals. In contrast the poorest decile spends about
0.03 per cent.
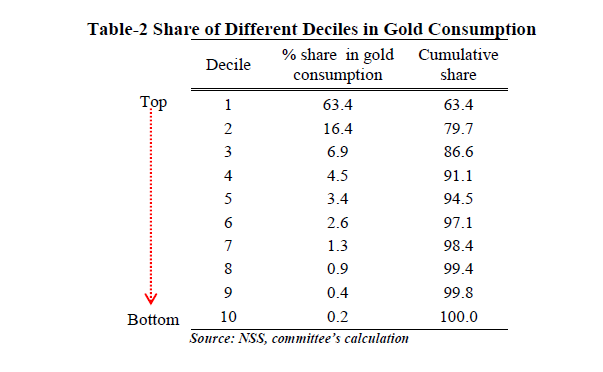
Table 2 highlights how ineffective or unfair is the implicit gold subsidy. It shows the expenditure
of these commodities of each decile as a share of total gold expenditures. The top decile accounts
for over 63 per cent of total gold expenditure. And this is a serious under-estimate because we
know that NSS is very ineffective at capturing the expenditure of the very rich. Cumulatively,
the top 2-3 deciles account for an overwhelming share of total gold consumption and therefore
appropriate nearly all the subsidy given to gold.
A second reason for favouring gold and precious metals could be to promote savings. At a time
when there were few savings instruments, it may have made sense to incentivize the purchase of gold via a lower rate in order to promote savings. But today, this objective has been overtaken by
two developments: on the one hand, the emphasis is on proper financial inclusion via the Jan
Dhan Yojana which would also serve as the more effective means of promoting savings; on the
other hand, gold far from being a desired savings instrument has become a problem, with large
gold purchases and imports becoming a cause of macro-economic instability.
Recognizing this, the government has recently tried to wean consumers away from gold via the
gold monetization and gold bond schemes. It would be perverse and contradictory to use taxes to
incentivize the holding of gold, and undo what the government is trying to do via these gold
schemes. At the very least, tax policy should be neutral on consuming precious metals.
Thus, on grounds of equity and effectiveness of targeting, on grounds of consistency of policy,
gold should be taxed at the standard rate (bullion can be exempted from the GST). Instead, it is
taxed at 1 percent, dramatically highlighting the incongruity of policy.
The final point to make, of course, is that the more rational gold taxation can be, the lower will
be the standard rate which will be critical in creating a buoyant and compliance friendly GST. As shown in Table 8, the standard rate could come down to as much as 16.8 per cent if gold is taxed
at 12 (6+6) per cent.
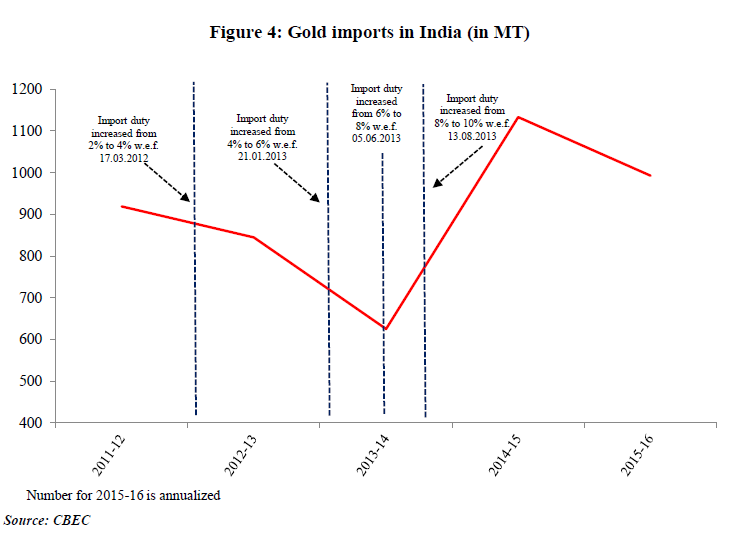
There might be concerns that increasing taxes on gold will lead to increased smuggling and
evasion. This is a legitimate concern. But there is some evidence on how serious the impact of
increased taxes might be. Import duties have been increased several times in the recent past on
gold. These too are tax increases. In Figure 4 below, we plot the imports of official gold since
2011-12 and highlight the timing of import duty increases. The chart clearly shows that there is
no seriously deleterious impact on gold imports in response to tariff increases. To some extent,
there will be declines in consumption and imports if taxes increase but these are modest and
manageable. The notion that there will be rampant evasion and smuggling if the taxation of gold
is increased is not borne out by the data.
Power, health, and education
Some key sectors have been excluded or exempt from the scope of GST. These include power,
health and education probably on the grounds that these are public goods, publicly provided, and
of importance to relatively poorer sections of the population. But what evidence do we have on
the underlying assumptions justifying such a policy?
Figure 2 suggests that these sectors are perhaps under-taxed currently (They lie well below and
to the left of the line of the best fit). The design of tax policy, thus, needs to more carefully take
account of evidence. For all three sectors, the benefits of exemptions (even without taking
account of any embedded taxes) for the poorer sections is small because these items constitute a
small share of their total expenditure. For the top 6 deciles, these sectors are three times as
important as they are for the bottom 4 deciles. Moreover, the top 6 deciles also consume such an
overwhelming large share of these services (probably privately provided) that nearly all the
benefits of the implicit subsidy go to the relatively well off. In the case of education, the current
tax structure turns out also to be regressive, with the bottom 4 deciles effectively paying greater
taxes than the top 6 deciles. These commodities deserve to be taxed more like standard goods.
Yet, today, they face low taxes and they are planned to be excluded from the GST.
Thus, tax policy in the name of the poor turns out to be poor or ineffective social policy. And the
cost is a tax base that is narrow, exemptions-ridden, and in the case of power, the cost also
includes breaking up the value added chain because it is an important intermediate input. In the
medium run, of course, direct benefit transfers or better public provision of essential services
would relieve tax policy of the burden of having to meet social objectives. But even in the short
run, greater attention needs to be devoted to finding better instruments of social policy, and
leaving tax policy to meet broad macro-economic objectives.
Notes:
1 Ideally, of course, if governments had well-designed transfer programs, they would achieve the desired objective of helping
poorer households by providing cash transfers and sparing the tax system from having to attain equity objectives. In practice,
this is not always possible and in India DBTs are still a work-in-progress. See Keen (2015).
2 The analysis can be re-worked for other target groups, say the bottom 3 or 5 deciles.
3 Strictly speaking, the benefit calculation should deduct the extra burden on the target group because the RNR will
go up as a result of the implicit subsidy. The RNR will go up to a greater extent the more the leakage that occurs to
non-target households.
4 So, for example, if the embedded taxes on a commodity is e (expressed in per cent), and t is the standard rate, then the effective
subsidy rate of exempting a good is (t-e)/E, where E is the total expenditure of the target group. In contrast, if that good is taxed
at the lower rate l, then the subsidy rate is (this ratio should be (t-(l-e))/E instead) because input tax credits will be available on
the embedded taxes.
5 The calculations in Figure 2 are somewhat tentative and subject to a number of caveats. There remains some uncertainty about
the assignment of tax rates to commodities in the data in the National Sample Survey, CPI and the Input-Output table. This
would have to be reviewed and refined in future work. Second, a key benefit of the GST will be the ability for producers to
claim input tax credits regardless of where their inputs are produced. The calculations have not fully reflected the input taxes
(except for petroleum products), and given that not all input taxes can currently be claimed this means that current tax rates are
effectively higher than what is reflected. Third, another factor that would increase the effective tax rates is central sales tax on
the movement of goods between States. In future work, this will need to be captured. Fourth, the calculations use 2011-12
consumption aggregates but 2015 tax rates. Finally, the calculations assume not only perfect compliance, but also ignored
threshold effects. Businesses below the VAT/Excise thresholds are not liable to collect tax, and this leads taxes to be overestimated,
especially for the B40 who would be more likely to shop in businesses below the threshold.
|